YESNCER monthly about hvac

Gaseous chemical contaminant test and pollutant source analysis of semiconductor wafer clean-rooms

Views : 1329
Update time : 2021-08-26 17:33:06
By Zhi Yuon. Zhang Dingchoo, Lu Junjie and Xia Qunyon
[Abstract] Taking the test results of gaseous chemical contaminants in a newly built semiconductor wafer clean-room in China as an example, adopts the method of combining long-term online detection with field measurement to analyse the change of indoor pollution and environmental control effect before and after installing a chemical filter and during the span between building and running the clean-room.Compares wih the outdoor air environment  and the different types of contaminants before and after operation, and determines the source information of different gaseous chemical contaminants in the clean-room. Finds that the actual removal efficiency of the chemical filter of the outdoor air unit is only 50%.which can not meet the requirement of 70% in the specification. The acid contaminants in the microelectronic clean-room mainly come from the outdoor air, while the ammonia gas comes from the outdoor air and building materials, such as cement, The pollution source of condensate is mainly indoor source, from indoor decoration materials. cleaning agents and production process materials.
[Keywords] clean-room, online monitoring, pollutant source analysis, gaseous chemical contaminant,chemical filter
0 introduction

With the rapid development of information technology, the market scale of microelectronics-related industrial clean plants in China has increased greatly, from 40 billion yuan in 2011 to 100 billion yuan in 2017, an increase of 150% year-on-year. By 2020, the market scale of microelectronics clean rooms in China will exceed 140 billion yuan. With the narrowing of the line width of large-scale integrated circuit chips, ultra-low concentration of molecular-level gaseous chemical pollutants has become the main factor affecting industrial development and yield. Gaseous chemical pollutants refer to molecular-level pollutants in the form of gas or vapor in the air, and in the microelectronic clean room environment, gaseous chemical pollutants are also called gaseous molecular pollutants(Airborne Molecular Continent, AMC), at present, the most authoritative classification basis is the standard of controlled environment of electronic clean room issued by International SEMIconductor Technology and Materials Association (Semi).
AMC is divided into four categories in this standard: 1) acids (MA), such as SO2,Acid pollutants such as NO2 and H2S: 2) alkali pollutants (MB), such as NH3 and amines; 3) Condensate (MC), which is called gaseous organic pollutants (TVOC) in civil buildings, will produce condensation on the product surface, such as toluene, benzene and other organic matters; 4) Doping state (MD), such as pollutants such as phosphorus and boron. Some literatures also put forward the fifth category: Other (ME), that is, ozone and other AMC which are not in the above classification. Another more detailed classification method is to classify AMC in clean rooms into eight categories according to ISO14644-8:2013 issued by the International Organization for Standardization (1SO): acid, alkali, biotoxins, condensables, corrosives, dopants, organic substances and oxides.

When AMC exists, it will pollute the surface of semiconductor wafers and corrode connecting wires, thus endangering the product quality. Therefore, it is very important to control AMC in microelectronic clean room to ensure the product yield. The basis of environmental control is to determine the status of target pollutants, such as the type, concentration and source of pollutants. only when the status and source of target pollutants are determined, can we take corresponding measures to control AMC in microelectronic clean room, thus ensuring product quality.
The method of determining AMC status in microelectronic clean room is field test. However, because the volume fraction of AMC in microelectronic clean room is extremely low, which can reach 10 or even 12 levels, the conventional IAQ detection methods in civil buildings, such as electrochemical instruments and spectrophotometry, can no longer accurately measure the actual concentration of AMC in microelectronic clean room. Because the environmental control belongs to the confidential technical scope of the manufacturer, and it is difficult for ordinary scholars to enter the microelectronic clean room for testing, there are few literatures to conduct on-the-spot test research on AMC condition in the microelectronic clean room from construction to trial operation. Muller and Tsao tested AMC in microelectronics clean rooms in USA and Taiwan Province, China respectively. However, their test results have the following problems: 1) The concentration of AMC in microelectronic clean room is not constant, but is constantly fluctuating, so the single constant concentration value measured by them can not reflect the real situation of AMC in microelectronic clean room; 2) Only the AMC concentration in clean room was measured, and the information of target pollutants and pollution traceability in microelectronic clean room environment could not be determined due to the lack of comparison of relevant environments. At the same time, at present, micro-electronics cleanness issued by organizations such as SEMI and ISO.Room pollutant control standard only classifies AMC concentration in microelectronic clean room, but does not specify target pollutants, pollution sources, concentration limits, etc. Therefore, there is still a gap in the research on AMC status and pollution sources in microelectronic clean rooms in China, which directly restricts the development of semiconductor chip manufacturing industry in China.

In this paper, the concentration, types and changes of AMC before and after installation of chemical filters in a new microelectronic clean workshop in China are analyzed by combining online monitoring and on-site testing. This paper analyzes the dynamic changes of AMC during the construction of microelectronic clean room on the time scale of construction life cycle, and compares it with the types and concentrations of pollutants in related literature. It also analyzes the emission status of pollutants at the source of microelectronic clean room, such as building materials, atmospheric environment and production technology, and obtains the characteristics of pollution sources and the shortcomings of the current environmental control system of microelectronic clean room, so as to guide the microelectronic clean room to take effective measures in the construction process, and reduce the pollution.
Concentration of AMC.
1 test contents and methods
1.1 project overview
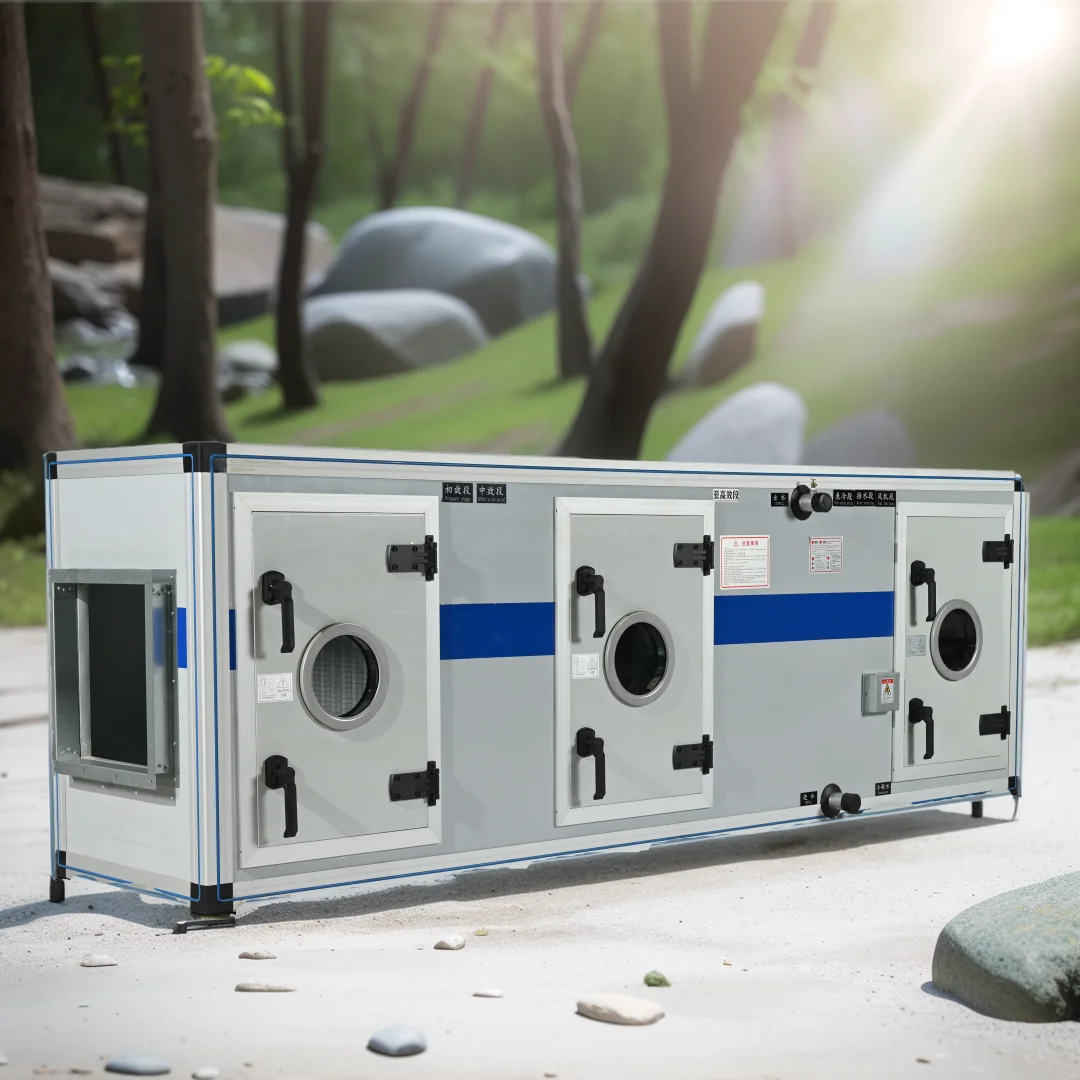
The microelectronics clean workshop is located in the Yangtze River Delta region of China, and its products are semiconductor wafer, which were built in 2019 and put into production at the end of 2020. The test area is the clean room in the electronic lithography process area of semiconductor wafer factory. When the test is started, the production equipment and ventilation system have been installed. During the test, the production equipment does not operate, the ventilation system operates normally, and the fresh air unit is equipped with chemical filters. The total test time is 80 days, including the time period after FFU (fan filter units) chemical filter is not installed in the clean room and FFU chemical filter is installed. The fresh air unit includes air inlet section → coarse filter section → medium filter section → primary heating section → primary surface cooling section → shower
There are 14 functional sections: water section → secondary surface cooling section → secondary heating section → humidification section → fan section → buffer section → chemical filtration section → high efficiency filtration section → air outlet section. There is no water washing purification function, and there is no equipment that can purify AMC except chemical filter. The fresh air unit sends the treated fresh air into the clean room. The area to be tested is an independent unit in the clean room, and the fresh air is sent into the test area through FFU system above the area.
1.2 test contents and methods

 
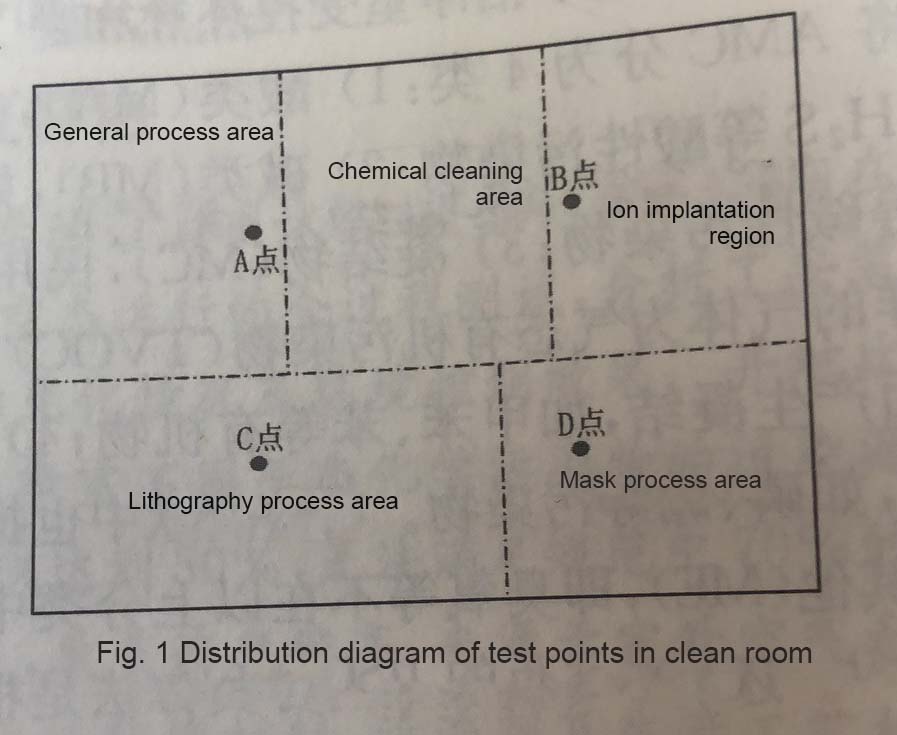
This test adopts a combination of long-term online monitoring and field sampling test. According to 1SO14644-8:2013 and ISO10121; In 2014, four common acid gases, SO2, NO2 and n0.H2S, were selected as the characteristic pollutants of MA, and NH3 was selected as the characteristic pollutant of MB. The concentration values of SO2, NO2, NO, NH3 and H2S in the clean room are collected by online monitoring, and the data collection time interval is up to 1d. Select four parallel test points in the clean room, and refer to 1s014644-8 according to the area of the test area; According to the requirements of 2013, the test methods are chemiluminescence method and ultraviolet fluorescence method recommended in GB/T 36306-2018 (Guidelines for Air Chemical Pollution Control in Clean Rooms and Related Controlled Environments). The distribution of test points is shown in Figure 1. Install the analyzer to the position to be measured, and connect the analyzer to the reformer, which is then connected to the sampling pump. At the beginning of the test, the three devices were turned on, and the air in the clean room entered the reformer at a flow rate of 0.2L/min through the sampling pump, and after reacting in the reformer, it entered the analyzer to obtain the pollutant concentration. MC concentration is tested and recorded by hand-held PID analyzer (model ppbRAE3000) at the same time every day, and TVOC concentration is measured by the analyzer. MC concentration of single component is obtained by collecting clean indoor gas in Suma tank, then concentrating and analyzing by GC-MS. The data of MA and MB finally displayed in this paper is the daily average concentration of four test points. The specific information of the test instrument is shown in Table 1.
Table 1 Information of instruments used for testing
instrument Test pollutants principle measuring range precision
SO2analyzer So2 H2S Pulsed ultraviolet fluorescence method 0~2000x10-9 0.5x10⁻⁹
NH3analyzer NO2 NO NH3 Chemiluminescence method 0~2000x10-9 0.5x10⁻⁹
ppbRAE3000 TVOC PID 0~5000x10-6 1.0x10⁻⁹
Gas chromatography-mass spectrometry linkage instrument individual event MC Chromatographic separation analysis   0.5ug/m³

2. Test results
2.1 analysis of AMC concentration level before installation of FFU chemical filter Before the FFU chemical filter was installed in the clean room, the test began in late October, 2019. The volume fractions of MA and MB monitored continuously for 45 days are shown in Figure 2.

It can be seen from Figure 2 that the concentration of AMC in microelectronic clean room fluctuates greatly, and the concentration of different kinds of pollutants is also very different. According to ISO14644-8:2013 cleanliness expression method, during the test, the average volume fraction of SO2 was 4.69×10⁻⁹, i.e. ISO-AC-6(SO2); The average volume fraction of NO2 is 26.71×10⁻⁹, that is, ISO-AMC-5(NO2). The average volume fraction of NO is 27.31×10⁻⁹, which means SO-AMC-5(NO). The average volume fraction of NH3 is 114.83×10⁻⁹, that is, ISO-AMC-4 (NH3), and the cleanliness grade of NH3 is the lowest. Without FFU chemical filter, NO2 concentration is much higher than SO2 concentration, which is about 7 times of SO2 concentration, and the average volume fractions of SO2 and NO2 in outdoor air of the city in November are 8×10⁻⁹ and 58×10-9(19), respectively, which is consistent with the conclusion that NO2 is the main chemical pollutant concerned by the author's research group's early analysis of atmospheric chemical pollution in China. The concentration of these two pollutants in the clean room is consistent with the numerical law of the concentration of the two pollutants in the atmosphere. It can be judged that the main source of MA is outdoor atmosphere. In addition, the chemical filter in the fresh air unit can reduce the concentration of AMC in the atmosphere to a certain extent. The removal efficiency of the chemical filter in the fresh air unit is about 50% based on the concentration of SO2 and NO2, while the requirement of GB/T36306-2018 in China is that the purification efficiency of the chemical filter in the fresh air unit reaches 70%. It can be seen that the actual operation effect of the chemical filter can not meet the expected requirements of the specification, and the control requirements of the specification can not be met only by the action of the chemical filter of the fresh air unit. At the same time, the volume fraction of NH3 in outdoor air is about (50~100)×10-, and the concentration of NH3 in clean room is obviously higher than that in outdoor air, so it can be concluded that NH3 in clean room comes from outdoor air on the one hand, and mainly from building materials such as cement on the other hand.
The test results of MC are shown in Figure 3. The average mass concentration of MC during the test period is 2118.23g/m3, which proves that there are a large number of VOC sources in clean interior decoration materials.

2.2 analysis of AMC concentration level after installation of FFU chemical filter
After FFU chemical filter (modified activated carbon filter material) was installed in clean room, it was tested from mid-December, 2019 for 31 days. The detected concentrations of MA(SO2 and H2S) and MB are shown in Figure 4, and the concentration of MC is shown in Figure 5.

It can be seen from figs. 4 and 5 that the concentration of various pollutants decreased after the FFU chemical filter was installed, especially MB and MC showed a trend of rapid decrease time by time. at this time, the cleanliness level of MB rose to so-AMC-5, and the cleanliness level of MC also rose to ISO-AMC-5, indicating that FFU chemical filter has a significant effect on AMC control. The control effects of various pollutants are shown in Table 2.
Table 2 Decrease of concentration of various pollutants
  SO2+H2S NH3 MC
Average before installation 9.6X10⁻⁹ 114.8X10⁻⁹ 2118.8ug/m³
Average value after installation 1.9X10⁻⁹ 54.9X10⁻⁹ 222.7ug/m³
Final stable value 1.9X10⁻⁹ 25.1X10⁻⁹ 67.7ug/m³
rate of decline 80.2% 78.1% 96.8%

2.3 MC pollution source analysis
Test results of single component MC obtained by suma tank sampling combined with GC-MS analysis are shown in table 3 and fig. 6.
Table 3 Test results of single component MC
 
  Volume fraction of point A Volume fraction of point B
toluene 1.69 0.5
ethylbenzene 2.43 2.09
ortho-xylene 3.10 2.26
M-p-xylene 8.56 6.90
dichloromethane 1.93 0.68
Chloroform (chloroform) 0.19 0.19
benzene 0.32 0.27
1,2- dichloroethane 1.76 0.44
1,1,2- trichloroethane 0.20 0.20
tetrachloroethylene 0.79 0.14
styrene 1.75 0.50
trimethylbenzene 0.64 0.48


It can be seen from Table 3 and Figure 6 that in the clean room of the semiconductor wafer factory which is not in operation, MC pollutants are mainly benzene, alkane and olefin. Benzene accounts for 83%, and its source should be clean indoor decoration materials, such as paint, waterproof filler, adhesive, etc. Alkanes and alkenes are not corrosive because of their low concentration Consider their corrosive effects on clean room process products.
In addition, compared with the related electronic clean room test results in references [12-13,24-25], besides the pollutants listed in Table 3, combined with the detection rate and pollutant concentration, the common MC pollutants and their concentrations in the running microelectronic clean workshop are shown in Table 4.

Table 4 Other MC pollutants in microelectronics clean room
  acetic acid ethanol Isopropyl alcohol carbon tetrafluoride Tetrafluoroethane hexafluoroethane
Volume fraction/10-9 18.2 184.7 71.4 2.4 37.3 92.3

Table 4 lists the common MC pollutants in clean rooms of semiconductor wafer factories mentioned in the literature, but they were not detected in this test. It shows that the source of these pollutants is not building materials or atmosphere, but should be produced in the production and operation process under the "dynamic" condition of clean room. Among them, ethanol and isopropanol should come from clean Cleaning agents used for indoor cleaning products, and several MC containing fluorine should be pollutants produced by various chemical reagents in the production process. To sum up, the pollution sources of MC in microelectronics clean room are mainly indoor sources, which come from indoor decoration materials, cleaning agents and production process materials. In order to analyze the source of MC in a targeted way, the components of MC should be sampled, tested and analyzed according to different process scenarios under the "dynamic" condition of clean room.
3 Conclusion
1) MA of clean room of semiconductor wafer factory mainly comes from outdoor air, while MB comes from outdoor air and building materials such as cement.
2) The chemical filter of the fresh air unit in the clean room has a certain effect on reducing the influence of pollutants in the air on the room, but the efficiency can not meet the requirements of environmental control. In order to control the indoor concentration to meet the production needs, FFU chemical filters for inorganic chemical gases should also be installed.
3) The pollution sources of MC in microelectronic clean room are mainly indoor sources, which come from indoor decoration materials, cleaning agents and production process materials. Sampling and testing in clean room should be paid attention to.
References:
[1] China Industry Information. Market Scale Forecast of Clean Room Engineering in China in 2018 [EB/OL.]. [2020-03-01]. http: ∥ www.chyxx.com/industry/201712/590649.html.
[2] Zhi Yuan, Liu Junjie. Analysis of environmental control standard of gaseous chemical pollution in electronic clean room [J]. HVAC, 2020,50(5):49-55
 [ 3] SEMI.Classification of airborne molecular contaminant levels in clean environments : SEMI F21 -1102-2012 [S]. Milpitas : North American Facilities Committee , 2012.3
 [ 4] HU S C . SHIUE A . Validation and application of the personnel factor for the garment used in cleanrooms [J]. Data in Brief . 2016 , 6 : 750-757
 [ 5] CHIU B . HU SC . SHIUE A et al . Reduction of airborne molecular contamination on an extreme ultraviolet reticle dual pod using clean dry air purging technology [J]. Microelectronic Engineering . 2016 .150:1-6
 [ 6] ZHI Y . LIU J J . Analysis of chemical filter performance and activated carbon microstructure at low concentration [J]. Building and Environment .2020,169:106563
 [7]ISO. Cleanrooms and associated controlled environments-part 8 : classification of air cleanliness by
 chemical concentration (ACC ): IS0 14644-8 : 2013 [S].
 Geneva : ISO Copyright Office , 2013 : 7-23
[8] Liu Feng, Research on Wafer Defects in Semiconductor Lithography [D].
Tianjin: Tianjin University, August 10, 2012
Wang Jie, Xie Pinhua, Si Fuqi, et al. Research progress of optical monitoring technology for atmospheric NH3 [j]. China Environmental Monitoring, 2012,28(2):54-61
[10] Chen Lu, Yi Yizhen, Tang Mingde, and other common air pollution in middle school students' dormitories
Investigation on the current situation of biological materials [j]. Practical Preventive Medicine, 2002,9(1):12-13
Tianyuan Chun, Sun Yabing, Feng Jingwei, et al. Study on SO2, HCHO and TVOCS pollution in Nanjing [J]. Chinese Journal of Environmental Sciences, 2007,27(2):190-194
[12] Zhao Zhongping, Li Zhongqin. Determination of COD in atmospheric aerosols by ion chromatography
Soluble ions [J]. Modern Scientific Instruments, 2004(5):46-49
[15] China electronic engineering design institute. clean room and related controlled environment: GB25915-2010[s]. Beijing: China environmental science press, 2010:9-20
[16] Japan Purification Association. Environmental Protection by Xi 'an ㄙヒ-Part 8: Cleanliness of Floating Molecular Chemical Pollutants: JIS B9917-8-2010[S]. Tokyo: Japan Standards Association, April 20, 2010
[17] National Technical Committee for Standardization of Clean Rooms and Related Controlled Environments. Guidelines for Air Chemical Pollution Control of Clean Rooms and Related Controlled Environments: GB/T36306-2018[S]. Beijing: China Environmental Science Press, 2018:10-27
[18] IS0 . Test method for assessing the performance of gas-phase air cleaning media and devices for general ventilation : ISO 10121 : 2014 [ S]. Geneva : ISO Copyright Office , 2014 : 8-25
[19] official website, Ministry of Ecology and Environment of China. Monthly report on urban air quality [EB/OL].
[2020-02-28]. http: // www. mee. gov. cn/hjzl/dghj /cskqzlzkyb/
[20] GUO J M , ZHAO M J ,XUE P,et al.New indicators for air quality and distribution characteristics of pollutants in China [ J]. Building and Environment , 2020 , 172 : 106723
 Li Xinyan, Li Hengpeng. Temporal and spatial distribution characteristics of atmospheric NH3 and NOX emissions in China [J] china environmental science, 2012,32(1):37-42[22 ] PARK J S , IKEDA K . Variations of formaldehyde and VOC levels during 3 years in new and older homes [J]. Indoor Air ,2006,16(2):129-135
[23] ASHRAE .1993 ASHRAE handbook-fundamentals[J]. Atlanta : ASHRAE Inc , 1993 : 379-391
[24 ] VANATTA L E . Application of ion chromatography in the semiconductor industry [j]. Trends in Analytical Chemistry , 2001 , 20 : 336-345
[25 ] WANG K F , LEI Y , EITAL M , et al . Ion chromatographic analysis of anions in ammonium hydroxide , hydrofluoric acid , and slurries , used in semiconductor processing [j]. Journal of Chromatography A . 2002 . 956 : 109-120

Source: Journal of HV&AC Heating Ventilating & Air Conditioning


Related News
Read More >>
Water source rooftop chiller unit part in HAVC Water source rooftop chiller unit part in HAVC
Mar .22.2024
The fan coil unit is a common HVAC system terminal device. It can be used independently or in conjunction with other equipment to provide more efficient cooling and heating services. One such example is the water-source chiller.
The quietness and efficiency of Guqin series Horizontal Ultra-Thin Concealed fan coil units The quietness and efficiency of Guqin series Horizontal Ultra-Thin Concealed fan coil units
Mar .22.2024
The Guqin Series Vertical and Horizontal Ultra-Thin Concealed Fan Coil Unit is a HVAC terminal component product produced by Yesncer, named after the world’s intangible cultural heritage – the Guqin. Not only does it have an exquisite appearance, but its
Ultra-low temperature air source heat pump principle and core technology Ultra-low temperature air source heat pump principle and core technology
Dec .27.2023
The principle of ultra-low temperature heat pump system is as follows.
Fan Coil Unit Selection And Product Advantages Fan Coil Unit Selection And Product Advantages
Dec .07.2023
Fan Coil Unit Selection And Product Advantages